Participatory MEAL: How Community Scorecards Improved Our VSLA Project.
Imagine sitting in a monitoring meeting where the program officer reads out indicators, the facilitator nods along, and everyone agrees things are going well while the women who actually use the program sit quietly in the back, never asked what they think.
That was not the kind of monitoring I wanted to run.
In 2024–2025, while supporting a caregiver-led Village Savings and Loan Association (VSLA) at Laminopabo Child Development Center in Northern Uganda, I shifted to a participatory approach using Community Scorecards. The women we were monitoring became the ones doing the monitoring. What followed surprised me not just in the quality of data we got, but in what the caregivers themselves started doing with it.
The gap in standard monitoring approaches.
VSLAs are built on trust. Members pool money, take loans, and depend on their leaders to keep accurate records. When something breaks down unfair loan distribution, a treasurer who isn't transparent, a woman who stops contributing because she feels excluded it rarely shows up in the indicators we track from the outside.
Repayment rates tell you something went wrong. They don't tell you why, or how long the problem existed before it became a number.
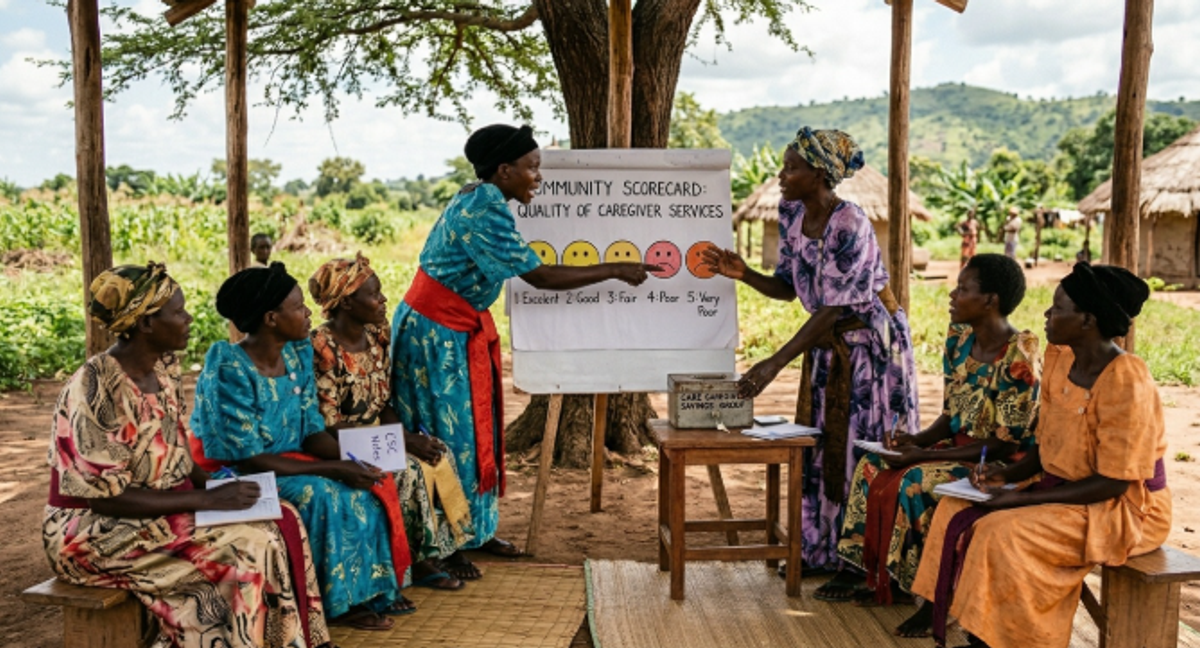
Community Scorecards address that gap. They are simple, visual tools where community members rate project performance against statements that matter to them, discuss the reasons behind their scores, and agree on action points together. We used smiley faces rather than numbers, which proved far more effective for members with low literacy. But the real value is never the scoring itself it is the conversation that follows.

Implementing scorecards in Northern Uganda.
The first thing I deliberately did not do was show up with a pre-designed scorecard.
Instead, we ran a workshop with 52 caregivers mostly women affected by HIV and conflict and asked one question: what does a well-functioning VSLA look like to you? Their answers shaped everything. They talked about loans being given fairly and on time. About leaders being open with the savings records. About feeling confident enough to ask questions in meetings without being dismissed. About whether their children were eating better and attending school more consistently.
Those conversations became our eight core indicators, anchored around four themes the group kept returning to: fairness and timeliness of loans, openness of savings records, confidence to speak up in meetings, and improvements in household nutrition and schooling. Not my indicators. Theirs.
We held scoring sessions quarterly, at the end of regular VSLA meetings so women didn't have to make a separate trip. One thing I learned early: when scoring happens in a mixed group, quieter members often follow the vocal ones. So we split into women-only groups first, scored independently, then came together for a joint discussion. The differences between groups were often where the most important conversations happened.
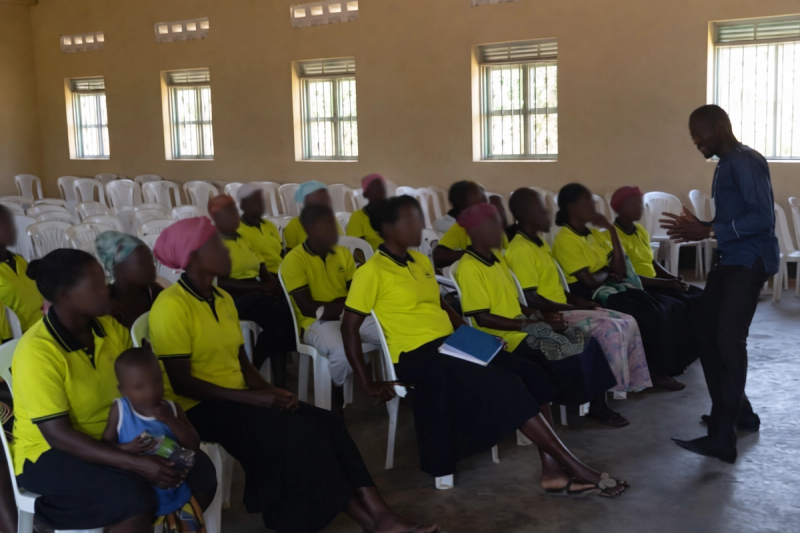
I facilitated the first few sessions then stepped back. Within two quarters, caregivers were running the process themselves. I observed and recorded. They asked the questions.
Accountability, 92% repayment, and one crisis averted.
The most immediate shift was in transparency. In the first round, leaders received low scores on record-keeping. Rather than defending themselves, they started displaying savings records publicly at every meeting not because I required it, but because the group had discussed it and agreed it was necessary. That demand for accountability came from within, not from an external monitor.
Loan repayment rates moved from 68% to 92% within six months. Better transparency and clearer group norms both played a role, but the scorecard created the space for those conversations to happen in the first place.
One outcome I didn't anticipate: the process surfaced a serious problem before it became a crisis. During one quarterly session, members in a sub-group gave unusually low scores on loan fairness. The discussion that followed revealed that a loan officer had been redirecting funds. Because the scorecard gave the group a structured, non-confrontational way to raise the concern, they addressed it internally before it escalated. An external audit would likely have missed this for months.
Women who had been silent in previous meetings became vocal. Several told me they started speaking up because they saw that their scores their opinions led to real changes. When people see that feedback produces results, they keep giving feedback. By the end of the project period, the VSLA had been formally registered as a Community-Based Organization, with caregivers leading the registration process themselves. That was not something we planned for. It grew out of the confidence the group had built through the process.
Integrating scorecards with KoboToolbox data.
One of the most useful adjustments I made was treating the scorecards and our KoboToolbox household surveys as partners rather than separate systems.
The Kobo data showed us trends changes in repayment, attendance, household expenditure. The scorecards gave us the why behind those trends. When both data streams told the same story, the evidence for donor reports became significantly stronger. When they told different stories, it meant something worth investigating. Qualitative and quantitative data are not in competition. Used together, they explain what neither can alone.
Three things that matter most if you try this.
Action has to follow scoring every time. In one session, a group scored transparency at 2 out of 5, the facilitator noted it, and nothing happened before the next quarter. Attendance at the following session dropped. Scorecards build trust when they lead to change and erode it when they don't. If you cannot commit to acting on what the community tells you, it is better not to run the process at all.
Invest in local facilitation capacity from the beginning. The goal is for the community to run the process without you. At Laminopabo, the VSLA now conducts quarterly scorecards with minimal support from CDC staff. That is what sustainability actually looks like.
And give the process time. The first session is often awkward people are cautious about scoring their own leaders, especially in public. By the third or fourth round, that caution usually gives way to honest engagement. The method earns trust the same way the VSLA does: through consistency and follow-through.
Participatory MEAL takes more upfront effort than distributing a questionnaire and entering results. But the data is more honest, the community is more invested, and the changes tend to stick because the people most affected were part of deciding what needed to change.
Ronald Obal
MEAL Manager & MEARL Specialist
Ronald Obal is a Monitoring, Evaluation, Accountability, Research and Learning professional focused on evidence systems for social impact programs in Uganda. With experience across mental health, child protection, education, and community development sectors.
Enjoyed this post? Follow for more.
Follow @real_obal